BellaBeat Project
This was my capstone project to receive the Google Data Analytics Professional Certificate.
I performed data analysis for Bellabeat, a high-tech manufacturer of health-focused products for women. I performed the analysis on R programming.
Company Overview
Urška Sršen and Sando Mur founded Bellabeat, a high-tech company that manufactures health-focused smart products. Bellabeat would like to analyze smart device usage data in order to gain insight into how people are already using their smart devices. Then, using this information would like high-level recommendations for how these trends can inform Bellabeat's marketing strategy.
Phase 1: Ask
Business Task
Identify new growth opportunities based on analysis of smart device data.
Stakeholders
Urška Sršen
Sando Mur
Marketing Analytics team
Phase 2: Prepare
Data Organisation
The dataset has 18 files, is in the long format and is stored in Kaggle. The data is generated by respondents to a distributed survey via Amazon Mechanical Turk between 03.12.2016-05.12.2016.The sample size is thirty eligible Fitbit users who consented to the submission of personal tracker data, including minute-level output for physical activity, heart rate, and sleep monitoring.
ROCCC:
Reliability: Small sample size of 30 participants reduces reliability.
Originality: The dataset is from a third party, the survery was administered by Amazon Mechanical Turk Between 03.12.2016 - 05.12.2016.
**Comprehensiveness: **Limited data about participant characteristics such as age and gender.
Current: The data is from 2016, thus, it is outdated.
Cited: Credibility is difficult to determine due to the lack of information.
Data Cleaning and Processing
Duplicates were removed by identifying the number of distinct users in each data frame.
Cells with "0" values were removed to prevent skewed results.
Date and time values in the daily sleep dataset were merged and needed to be separated.
Column names were standardised into all lowercase,
Date values have the wrong formatting and needed to be changed into the date format.
Summary Statistics Key Findings
The average Fitbit user takes 8,329 steps.
The average Fitbit user spends 419.5 minutes asleep.
Hypotheses
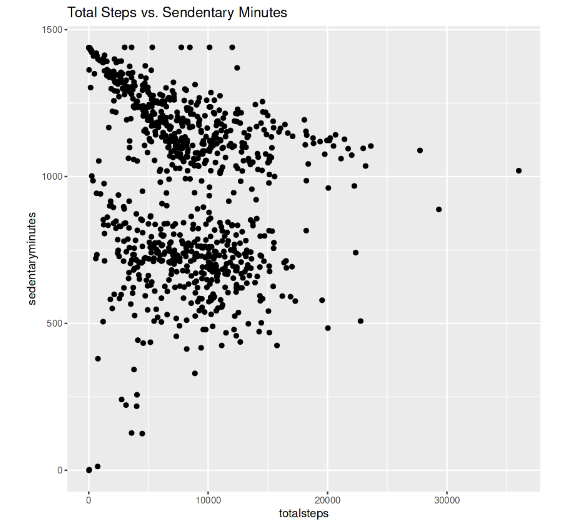
Hypothesis 1: The total steps taken are negatively correlated with sedentary minutes.
Finding: The data visualization suggests a negative correlation between the total steps taken and sedentary minutes, meaning the greater the sedentary minutes, the lower the total steps taken.
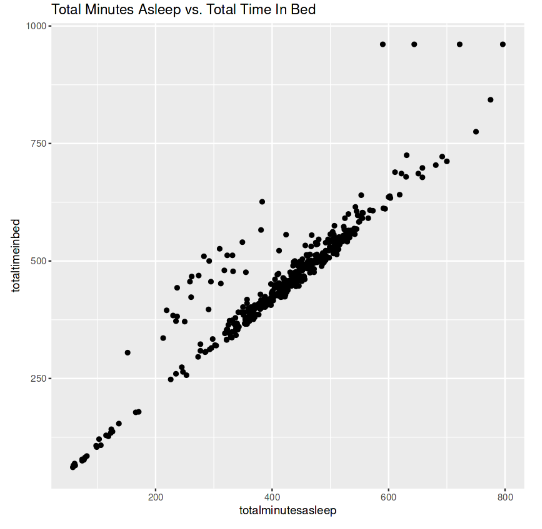
Hypothesis 2: The total time in bed is positively correlated with time in bed.
Finding: The data visualisation suggests a positive correlation between total minutes asleep and total minutes in bed, which means the greater minutes in bed, the greater the total minutes asleep.
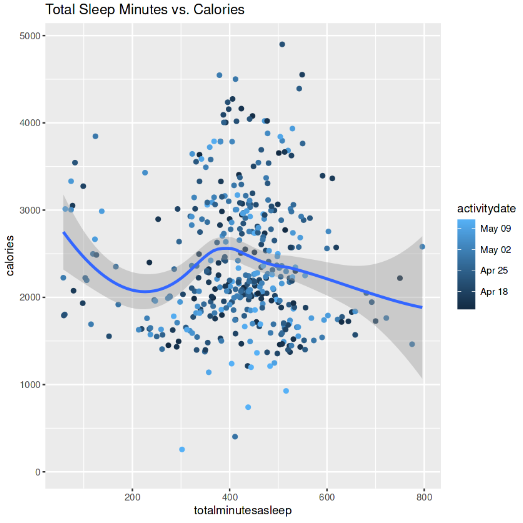
Hypothesis 3: The total steps taken are positively correlated with calories burned.
Finding: The data visualisation suggests a positive correlation between calories and total steps, which means the greater the total steps taken, the greater calories burnt.


-57f4e00f.png)

